This manual is for NURS-FPX6620 Assessment 1, start to submission. Send us the scoring guide and a premium original sample for this assessment comes back inside 24 to 48 hours, revised free until it meets the guide. Assessment 1 in this course usually asks for analytic work rather than a plan: a population defined in numbers, several care delivery and coordination models set beside each other, and a defended judgment about which one that population's data supports. Your scoring guide decides the exact deliverable, so read it before anything else. What follows is the method our tutors use for a model analysis at master's level, a structure that maps to the criteria, and an annotated excerpt. Your courseroom may print this as NURS FPX 6620 Assessment 1 or NURS6620 Assessment 1; it is the same deliverable, and NURS-FPX6620 Assessment 1 is what this manual walks through.
One honesty note before the manual: Capella revises courses and scoring guides over time, so always write to the exact scoring guide attached to your assessment in the courseroom. The course identity above is verified on capella.edu; the method and structure below are our tutors' approach to it, not Capella's official rubric text.
How NURS-FPX6620 Assessment 1 is scored
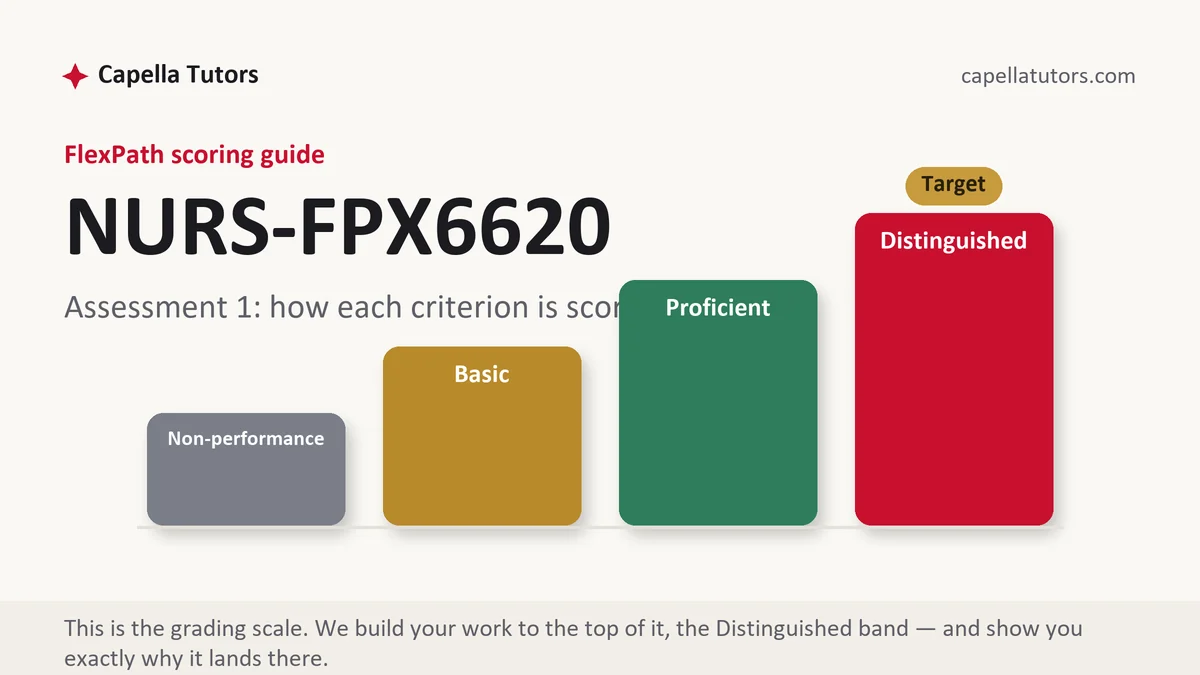
FlexPath returns a level for each criterion rather than a grade, and those four descriptions are the real brief for a comparative analysis:
| Level | What it means on a model analysis |
|---|---|
| Distinguished | Models are judged against dimensions you stated in advance, the population data selects the winner, and each model's research base is weighed instead of assumed. The paper also states what its own choice will not fix. |
| Proficient | Every model is described accurately and applied to the population, complete but unranked, with the comparison left implicit at the exact point the criterion asked for a verdict. |
| Basic | A tour of models, a paragraph each, closing on a preference the evidence was never asked to support. This is where most first submissions in a models course land. |
| Non-performance | A required element is absent rather than thin, most often the population data or the comparison itself. Missing always scores below weak. |
Two habits lift several criteria at once here. Attribute every figure to a named source, and state the standard you are comparing on before you compare anything. An evaluator who can audit your reasoning can also see it, and criteria built around analysis pay for reasoning that is visible on the page.
The NURS-FPX6620 Assessment 1 method, step by step
-
Convert each criterion into a question
Take the scoring guide and rewrite every criterion as the question it is actually asking, then answer that question inside its own labeled section. A criterion that asks you to analyze coordination models for a population is asking two things at once, which models and for whom, so a section that settles only the first leaves half the criterion unmet and caps you at Proficient.
-
Size the population before you name a single model
Write the cohort in numbers: how many people, what payer mix, what utilization looks like today. For dually eligible adults spread across several specialists with no shared plan, public data carries most of the load, since CMS reports enrollment and service use for dual-eligible beneficiaries and AHRQ statistical briefs give readmission and ambulatory care sensitive admission rates by payer. Cite the dataset itself rather than an article describing it.
-
Choose three models that could genuinely lose
A comparison needs contenders that differ in structure, accountability, and money. An integrated plan built for dually eligible members, a nurse-led complex care management team inside a primary care group, and a specialty-anchored medical home are three real answers to one fragmentation problem. Two variants of the same idea leave nothing at stake, and the comparison criterion is written to detect exactly that.
-
Attribute every model to its primary source
Cite the people who built the model rather than the textbook that summarized it. The chronic care model, the transitional care model, and the care transitions intervention all have originating publications that state their active components and the population studied, which is the material your fit argument needs. Models sourced to a review article read as second-hand at master's level, and faculty who know this literature notice immediately.
-
Compare on stated dimensions, then argue what the table cannot
Fix four or five dimensions before drafting: who owns the plan, how strong the evidence is, what data the model needs, what it costs to stand up, and how closely it matches the cohort's failure pattern. Rate each model on each dimension in a table, then write the argument a table can never make, which is why one dimension outweighs the others for this population.
-
Self-score criterion by criterion, then submit early in the week
Read the draft against the guide one criterion at a time and mark yourself Distinguished, Proficient, Basic, or Non-performance, then rewrite anything below the top level. Evaluations can take up to two business days, so submitting Monday or Tuesday leaves room to work the comments inside the same flat-rate session.
A structure that maps to the criteria
Word targets are planning figures our tutors use for a master's model analysis, not Capella rules; your scoring guide decides the real proportions.
| Section | What it must do | Guide |
|---|---|---|
| Introduction and purpose | Name the coordination problem, the population carrying it, and the decision this analysis exists to inform. | ~150 words |
| Population profile | The cohort sized and characterized: enrollment, payer mix, baseline utilization, and the failure pattern a model has to interrupt. | ~300 words |
| Model descriptions | Three models, each with its structure, its accountability arrangement, its funding logic, and its originating source. | ~450 words |
| Comparative analysis | The models rated against your stated dimensions, with evidence strength handled as one of those dimensions. | ~350 words |
| Conclusion and implications | The model the analysis selects, the local conditions it needs, and the problem it leaves standing. | ~200 words |
| References | Current APA 7, peer-reviewed studies plus federal agency reports, each model tied to the publication that defined it. | as needed |
Annotated sample excerpt
An original excerpt written by our team, showing the register a comparative analysis needs. Learn the moves, then rebuild it around your own cohort.
The cohort is 4,180 adults enrolled in both Medicare and Medicaid across a two-county service area, 61 percent of them carrying four or more chronic conditions and a median of five prescribing clinicians each.1 Claims for the most recent complete year show 38 percent with at least one ambulatory care sensitive admission and a median of 11 specialty visits, with no care plan visible to more than one practice.2 Fragmentation rather than access is the failure pattern here, since this population sees clinicians often and is coordinated by none of them, and that is the specific gap each model below is judged against.3
- 1The cohort arrives sized in the opening sentence. One count and one payer status do more for the population criterion than a paragraph of adjectives, and in the finished paper every figure carries a citation to a public dataset with estimates labeled as estimates.
- 2Baseline utilization is stated as measures the chosen model could plausibly move, which lets the later recommendation be checked instead of believed.
- 3The failure pattern is named in a single sentence and aimed forward at the comparison. This is the sentence that turns description into analysis, and it is the one most drafts never write.
The full premium sample for your exact assessment, written fresh to your scoring guide and issue, is free to request. Study it, revise it into your own voice, and submit work you understand.
The five mistakes that cost Distinguished
- The catalogue. Models presented one after another on their own terms, with no shared dimensions to judge them by.
- An unsized population. A cohort named by diagnosis alone, with no enrollment count, payer mix, or baseline rate, which leaves the fit argument resting on assertion.
- Second-hand models. A framework credited to a textbook chapter or review article instead of the primary publication that defined its components.
- Flat evidence. A model tested across dozens of sites and a model tested once in one clinic, written up in the same confident voice.
- A verdict with no cost. A choice that names no trade-off, no limit, and nobody who is worse off under it.
Pre-submission checklist
- Every criterion has its own labeled section, in the order the guide lists them
- The population is sized, with each figure attributed to a named public dataset
- Three models compared, each attributed to the primary source that defined it
- Comparison dimensions stated before the comparison and applied to all three models
- Evidence strength discussed per model, with the thinner research bases named as thinner
- APA 7 matched both ways, and the draft self-scored Distinguished on every criterion
Working on this one right now?
Send the scoring guide and the population you have in mind. A premium original sample comes back inside 24 to 48 hours, built to the top column and revised free until it lands there. A research analyst pulls the model literature and two reviewers check criteria coverage and APA before a page reaches you.