This manual is for NURS-FPX6116 Assessment 5, start to submission. We build the deck and the speaker notes to your scoring guide and return them in 24 to 48 hours, revised free until the criteria clear. Assessment 5 of NURS-FPX6116 usually asks for a presentation on program effectiveness for an audience with authority, faculty, an advisory board, or an accreditation reviewer, arguing from aggregated data rather than from individual results. The criteria are looking for benchmarks, trends across cohorts, and a decision the audience is being asked to make. Method, structure, and an annotated sample of speaker notes follow. Your courseroom may print this as NURS FPX 6116 Assessment 5 or NURS6116 Assessment 5; it is the same deliverable, and NURS-FPX6116 Assessment 5 is what this manual walks through.
One honesty note before the manual: Capella revises courses and scoring guides over time, so always write to the exact scoring guide attached to your assessment in the courseroom. The course identity above is verified on capella.edu; the method and structure below are our tutors' approach to it, not Capella's official rubric text.
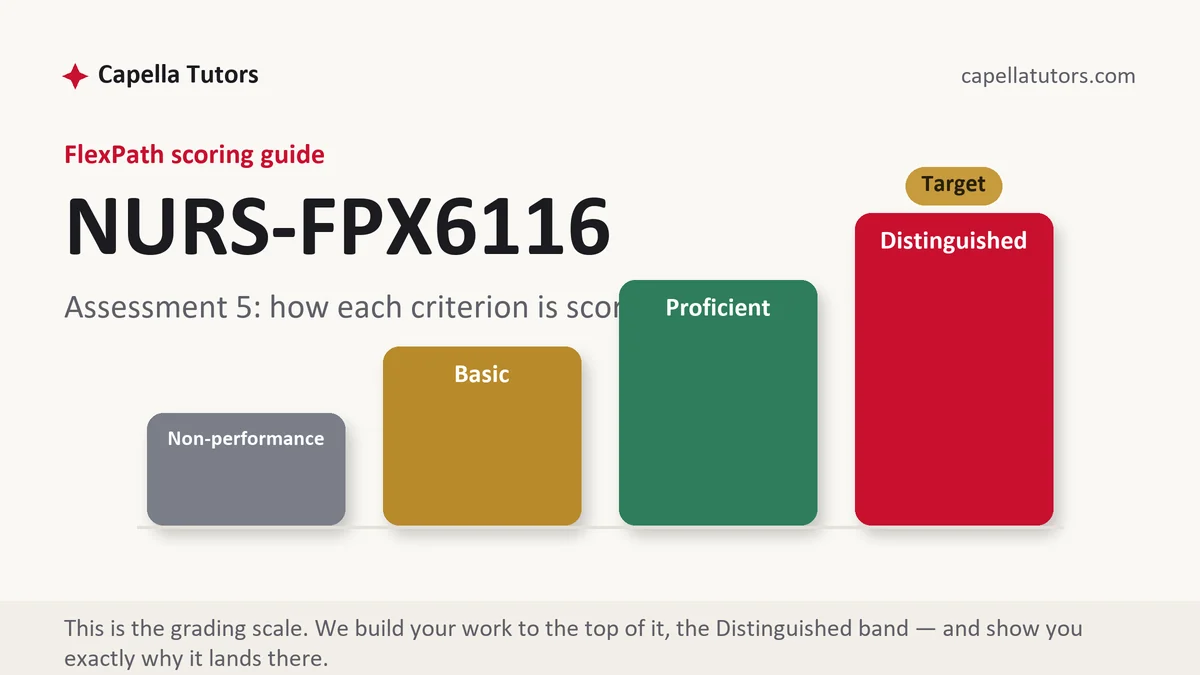
How NURS-FPX6116 Assessment 5 is scored
Each criterion lands on one of four levels, and on a presentation the level language applies to the notes as much as to the slides:
| Level | What it means on a program effectiveness presentation |
|---|---|
| Distinguished | Every measure appears against a stated benchmark with a trend across at least three cohorts, one measure that is failing is presented rather than buried, and the audience is asked for a specific decision with a date attached. |
| Proficient | Accurate aggregated data presented clearly against benchmarks. The presentation reports rather than recommends, which is the step the top column requires. |
| Basic | Slides of pass rates and satisfaction scores with no benchmarks, no trend, and speaker notes that read the numbers aloud. |
| Non-performance | A required measure is missing, commonly employer or alumni data or the aggregation across cohorts, and absence scores below weakness. |
The measure set is what makes this credible. Licensure or certification results against the national comparison, course and program completion, employer feedback on new graduate performance, alumni report at six or twelve months, and the aggregated performance data your own instruments produce. Reaction data sits at the bottom of any evaluation model, so label it as reaction and let the learning and performance measures carry the argument.
The NURS-FPX6116 Assessment 5 method, step by step
-
Build slide families from the criteria and name the audience
One criterion, one short run of slides, titled in the criterion's verb so an evaluator finds it instantly. Then decide the audience on the first slide, because faculty, an advisory board, and a site visitor need different framing, and a presentation that does not know who it is speaking to cannot ask for a decision at the end.
-
Aggregate before you present, and say how you aggregated
Individual results are assessment; program effectiveness is aggregate. State the cohorts, the numbers in each, and the rule you used, whether that is first attempt only, all attempts, or completers only. Reviewers ask that question every time, and answering it before it is asked is a mark of the register the criteria reward.
-
Put a benchmark on every measure and cite its source
A number with no comparator cannot be judged. Licensure results go against the national or jurisdictional comparison for the same period, completion goes against the program's own published expectation, and instrument based measures go against the threshold your evaluation plan set. Say where each benchmark comes from, and where the program set it itself, say that plainly.
-
Show trend across cohorts, not a single point
Three cohorts minimum wherever the data exists, because a single year is noise. Say which direction each measure is moving and how much of the movement is plausibly real given cohort sizes in the tens rather than the thousands. A presentation that treats a four point change in a cohort of 60 as a finding will be corrected in the room.
-
Present the failing measure first
Find the measure that is under benchmark and put it early, with your account of why. A curriculum revision mid stream, a clinical placement shortage, a cohort admitted under changed prerequisites. Presenting a weakness with an analysis attached buys the audience's trust for everything else on the slides, and hiding it is the single fastest way to lose the analysis criterion.
-
Ask for a decision, with an owner and a date
End on a request, not a summary. Which committee approves what, by when, and what will be re measured to test whether it worked. Then say what you would need to make a stronger case next year, whether that is employer survey response rates above their current level or performance data from an instrument with published reliability. A presentation that closes the loop is what the top of the guide describes.
A structure that maps to the criteria
A slide plan our tutors use for an effectiveness presentation of this kind, with the notes carrying the argument. Your scoring guide sets the real slide count.
| Section | What it must do | Guide |
|---|---|---|
| Title, audience, and the ask | Who is in the room, what is being evaluated, and the decision you will request. | 1 slide |
| Method and aggregation rules | Cohorts, sizes, and the counting rule used for every measure. | 1 to 2 slides |
| The measure under benchmark | The failing measure, its trend, and your account of why it moved. | 2 slides |
| Licensure, completion, and performance | Each measure against its benchmark with three cohort trend shown. | 3 slides |
| Employer and alumni evidence | Response rates stated, findings summarized, and limits acknowledged. | 2 slides |
| Decision requested | The action, the committee, the date, and the re measurement that tests it. | 1 to 2 slides |
| References | Current APA, benchmarks and criteria cited as organizational reports. | 1 slide |
Annotated sample excerpt
An original model of speaker notes from our writers, at the level a program review demands. Presentations are graded on the notes, so read these closely.
The measure under benchmark is first attempt licensure performance, which sits at 84 percent for the cohort that graduated in May against a program benchmark of 90 and a national comparison of 88 for the same period, and it has moved from 93 to 89 to 84 across three cohorts of 58, 61, and 60 students.1 That trend is worth taking seriously precisely because the cohorts are small, since three consecutive declines in samples of roughly 60 is a pattern rather than a fluctuation, and it tracks the two years in which the concept-based revision ran alongside the retiring curriculum with students taking courses from both.2 I am asking the curriculum committee for one decision today: approve a licensure content audit of the four concept modules against the current test plan, assigned to the assessment coordinator, reported back on 15 November, with the incoming cohort's first attempt result read against the same 90 percent benchmark next June.3
- 1Puts the failing measure first with its benchmark, its national comparator, and the cohort sizes, which is the honesty the analysis criterion rewards.
- 2Reasons about whether the trend is real given small cohorts, then links it to a specific curricular event rather than to a general concern.
- 3Closes with a single decision, an owner, a report date, and the re measurement. A presentation that asks for one thing gets it; a presentation that summarizes gets discussion.
The full premium sample for your exact assessment, written fresh to your scoring guide and issue, is free to request. Study it, revise it into your own voice, and submit work you understand.
The five mistakes that cost Distinguished
- Numbers without benchmarks. A pass rate on a slide with no comparator cannot be judged, and the evaluation criteria are built on comparison.
- One cohort presented as a trend. Single year data in a program of sixty students is noise, and any experienced reviewer will say so.
- The weak measure buried. Leading with strengths and hiding the failing measure late costs credibility and the analysis criterion at once.
- Satisfaction carrying the argument. Reaction data is the weakest level in every evaluation model, and a case built on it will not survive the room.
- A summary instead of an ask. A closing slide that restates the findings leaves the audience with nothing to approve and the loop open.
Pre-submission checklist
- Audience named on the first slide and addressed throughout the notes
- Cohorts, sizes, and the counting rule stated before any measure appears
- Every measure shown against a benchmark whose source is named
- Trend across at least three cohorts wherever the data exists
- The failing measure presented early with an account of why it moved
- One decision requested with an owner, a date, and the re measurement that tests it
Effectiveness presentation with data you have not shaped yet?
Send the scoring guide and whatever the program will release, licensure results, completion figures, employer survey summaries, instrument scores. We aggregate it, benchmark every measure, build the trend, and write the speaker notes as argued prose ending in a single decision. Back in 24 to 48 hours, revised until the criteria clear, and the first premium sample is on us.