Help for every NURS-FPX4055 deliverable lives on this page — a premium original sample with a walkthrough, back in 24 to 48 hours. The course itself: Optimizing Population Health through Community Practice, listed at 3 pts / 6 quarter credits in Capella’s RN-to-BSN catalog, offered in both FlexPath and GuidedPath. Both spellings reach it, NURS4055 and NURS-FPX4055.
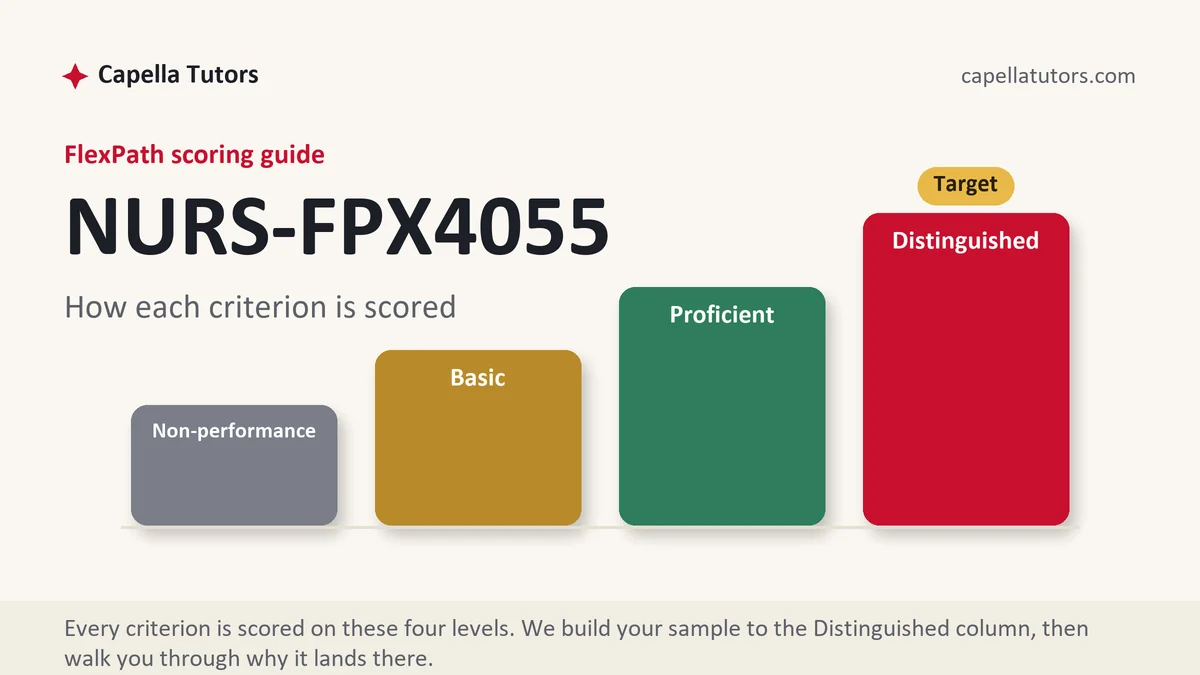
What NURS-FPX4055 actually grades
The population-health course moves the lens from one patient to a community: needs assessments, intervention plans, and health-promotion writing built on demographic and epidemiological data. Distinguished-level work here names a real population with real numbers and designs for its specific barriers, cost, transport, literacy, culture, where Basic work writes about communities in the abstract.
How we help in this course
We build these deliverables around an actual community data picture, public health statistics woven into the argument, interventions matched to the barriers the data shows, evaluation plans that could genuinely run. It is the course where our research analyst earns the fee most visibly.
Every deliverable in the course follows our standard promise: a premium original draft in 24 to 48 hours, written to the Distinguished column on FlexPath or the A rubric row on GuidedPath, through the eight-person pipeline with both QA passes, revised free until it meets target.
Assessment manuals for this course
Every assessment in NURS-FPX4055 has its own manual now: the walkthrough, the structure that maps to the criteria, an annotated sample excerpt, and the done-for-you door. Open Assessment 1, Assessment 2, Assessment 3, Assessment 4, or start from the list in the sidebar.
In NURS-FPX4055 right now?
Send the assessment number and the scoring guide from your courseroom. First premium sample free, back in 24 to 48 hours.
What Distinguished population writing actually contains
The gap between Basic and Distinguished in 4055 is measured in specificity: a real population with real numbers, interventions designed for its documented barriers, an evaluation plan that could genuinely run. Communities discussed in the abstract score low because the criteria are written to demand demographic and epidemiological grounding, and evaluators apply them literally. This is the course where our research analyst is most visible in the finished work, public-health statistics woven through the argument so every criterion's evidence expectation is met with data rather than sentiment.
Keeping a data-heavy course on the session clock
Data work tempts delay, and delay is what the flat-rate FlexPath session punishes. The desk holds the standard turnaround anyway: assessment materials in, a premium draft back within 24 to 48 hours, evaluated, next assessment started, the loop that keeps a 3-point course closing on plan. On GuidedPath the same drafts are simply scheduled against the fixed Thursday and Sunday Central deadlines of the 10-week quarter. Both formats get the evidence table built before drafting begins, sources assigned to criteria the way the guides expect.
Do I need to pick the community before ordering?
No. Name a county, city, or population you have access to and the scope reply will confirm whether its published data can carry the assessment, before anything is drafted.
What does the first free draft include here?
The complete assessment with its data picture assembled, criterion map attached, so you can verify the statistical grounding yourself before placing a paid order.
The assessments, one by one
Assessment 1
The health promotion plan for a named population. Read the full Assessment 1 manual.
Assessment 2
Community resources and systems analyzed like someone who made the calls. Read the full Assessment 2 manual.
Assessment 3
Population-level intervention or preparedness writing. Read the full Assessment 3 manual.
Assessment 4
The community-practice synthesis that closes the course. Read the full Assessment 4 manual.
How to actually write NURS-FPX4055: where to begin
Start with the scoring guide, not the instructions. Make the criterion list your table of contents, the Distinguished description pasted under each entry, and treat that outline as the assignment. The assessments in this course usually walk one arc: profile a community, identify a health need from its data, then design and evaluate an intervention or health-promotion plan for a specific population inside it. Whatever the exact deliverable, the criteria keep asking the same three questions: which population, what does the data say, and does the plan answer the data.
Choose the community before you write anything, and choose one you can reach data for. Your own county or city is almost always the right answer; the assessments reward local knowledge and local numbers. Then pull the data before drafting: County Health Rankings for the county-level picture, CDC data for prevalence and trend, your state and county health department reports for the local layer, and Healthy People 2030 for the objectives your goals will align with. Numbers first, writing second. A criterion asking you to describe the community's health status is really asking for three or four cited statistics compared against a benchmark.
Population specificity is the whole grade in this course. Writing about communities in the abstract, access to care matters, health literacy is a challenge, reads as Basic on nearly every criterion. Naming a population with numbers, adults over 65 in a county where the uninsured rate runs above the state average, and designing for its documented barriers, cost, transport, literacy, culture, is what the Distinguished descriptions are written to reward.
| Section | What goes in it | What Distinguished looks like |
|---|---|---|
| Community and population profile | Demographics, geography, and the numbers that describe the population's health status. | A named county or city with cited data, compared against state or national benchmarks. |
| The health need | The problem the data shows, stated with prevalence and trend. | The need argued from at least two data sources that agree, with the gap against the benchmark quantified. |
| Intervention or health-promotion plan | What you will do, for whom, through which community channels. | Each element of the plan answers a documented barrier, cost, transport, literacy, culture, not a generic one. |
| Goals and alignment | Measurable goals for the population, tied to recognized objectives. | SMART goals mapped to a named Healthy People 2030 objective, with a baseline and a target number. |
| Evaluation plan | How you will know the intervention worked, with measures and timing. | Measures that could genuinely run: a named data source, a collection interval, and the number that defines success. |
Developing the synthesis
Synthesis in 4055 happens twice, once with data and once with intervention evidence. With data, put two numbers in tension: the state diabetes rate says one thing, your county's rate says something worse, and that gap is your argument for acting locally. With intervention evidence, pair studies that disagree. One trial finds text-message reminders raised screening rates in an urban system; another finds community health workers outperformed reminders in a rural population. Listing both findings is Basic; adjudicating between them is Distinguished. Weigh the designs, a randomized trial against a retrospective review, then weigh the fit, which study's population looks like yours, and let fit break the tie. Tie the verdict to the criterion it serves, and name what the evidence cannot settle: most intervention studies run in settings unlike yours, and saying so, then explaining why the mechanism should transfer, is the limitation paragraph the top column rewards.
Citations that survive faculty review
This course runs on two source types and grades both. Intervention evidence should be peer-reviewed and published within roughly the last five years, pulled from CINAHL or PubMed through the Capella library. Population data comes from the public sources named above, cited as reports in APA 7 form with the year the dataset was updated, not the year you looked. Work every citation into the sentence making the claim rather than dropping a parenthetical after the paragraph has finished arguing. Each source should do named work for a named criterion: this ranking establishes the need, this trial justifies the intervention, this objective anchors the goal. A source without a job is padding.
The mistakes that land Basic instead of Distinguished
- A community discussed in the abstract, no named place, no cited numbers.
- Data pasted in a block and never argued; a table of statistics stays Basic until a sentence says what it means.
- An intervention lifted from a textbook that answers no documented local barrier.
- Goals that cannot be measured, increase awareness with no baseline and no target.
- Statistics older than five years from sources that publish annual updates.
NURS-FPX4055 questions students actually ask
Which community should I choose?
Your own county or city, decided by data availability rather than sentiment. Before committing, spend ten minutes on County Health Rankings and your state health department site; if the town is too small to have published numbers, widen to the county, which nearly always does. A community you can describe from experience plus data you can actually cite beats an interesting community you know only from headlines.
Where do I find the population data?
Four stops cover most 4055 assessments: County Health Rankings for the comparative county picture, CDC data for national prevalence and trend, your state and county health department for local reports, and Healthy People 2030 for the objectives your goals align with. Census data fills demographic gaps. Cite each as a report with its update year, and note where every number came from as you collect it.
Does my intervention need to be original?
No, and inventing one usually hurts you. The criteria ask for an evidence-based intervention matched to your population's documented barriers, so the strongest move is choosing a tested intervention and arguing its fit: the trial ran in a population like yours, the mechanism answers the barrier your data shows, the resources it needs exist locally. The originality that scores is in the fit argument, not the invention.